


Most interesting data points and charts from 2022 (Part II)

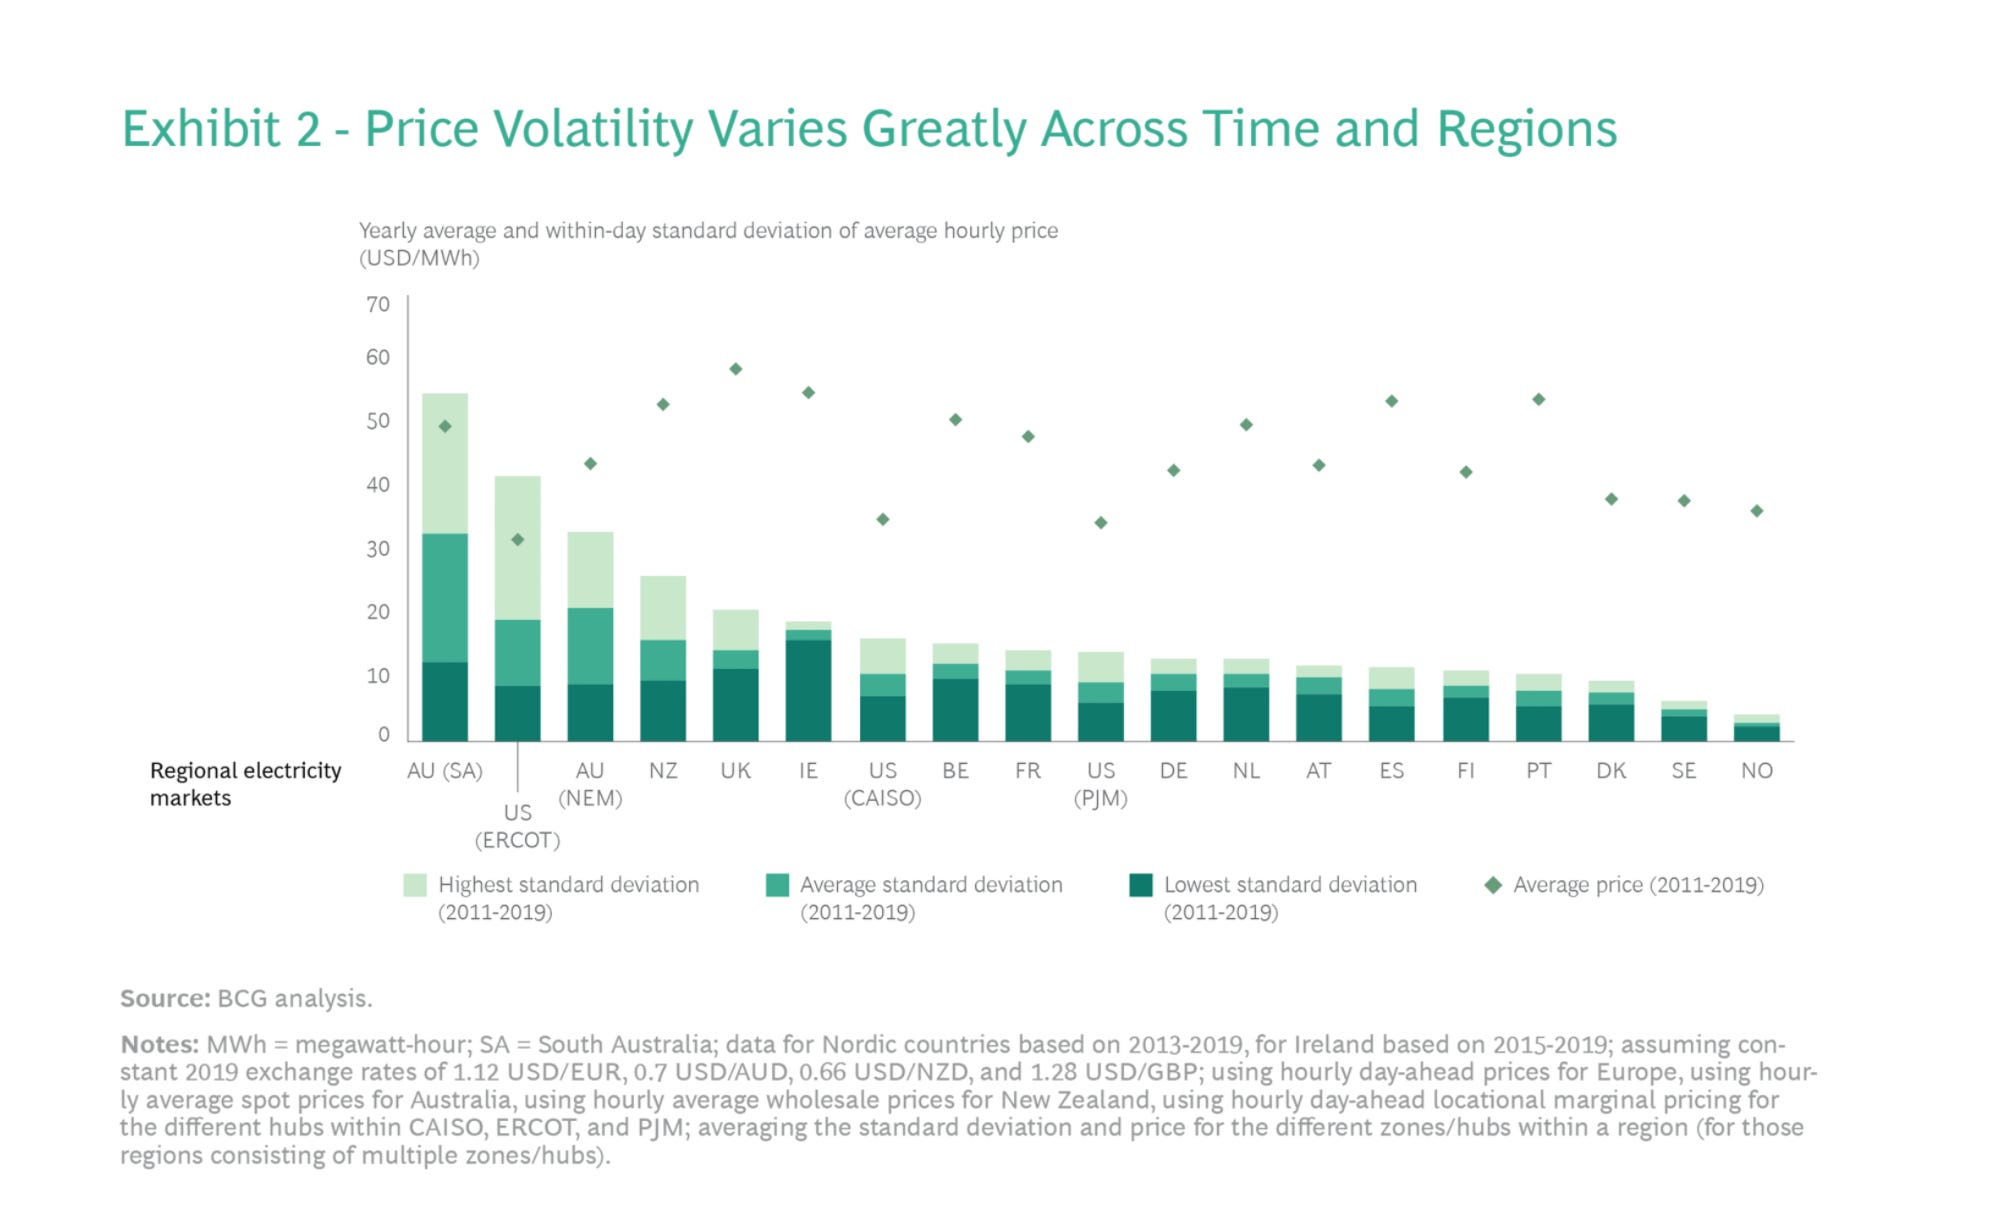
Electricity prices will be increasingly volatile as more renewables come online globally. Why? Because renewables production goes from zero to 100% in a few hours of design output. Wind production is usually more volatile than solar. This is made evident by DCSR ratios provided by lenders. Solar is around 1.2x vs wind which is around 1.3x.
This chart below is a bit dated now (from Q1/2022), but still relevant. Short-story, operators of renewable energy assets will likely need power trading teams going forward.
Power market liquidity might remain low in some jurisdictions, but capitalizing on buy/sell positions in the open market will likely be a trend. Prop trading firms are likely to be bought out or exhibit increasing demand.
Your EV isn’t as clean as you might have thought. Depending on where the rare earth metals were sourced, chances are that the carbon footprint of an EV is not ‘significantly’ lower than a standard ICE. But switching is a step in the right direction.

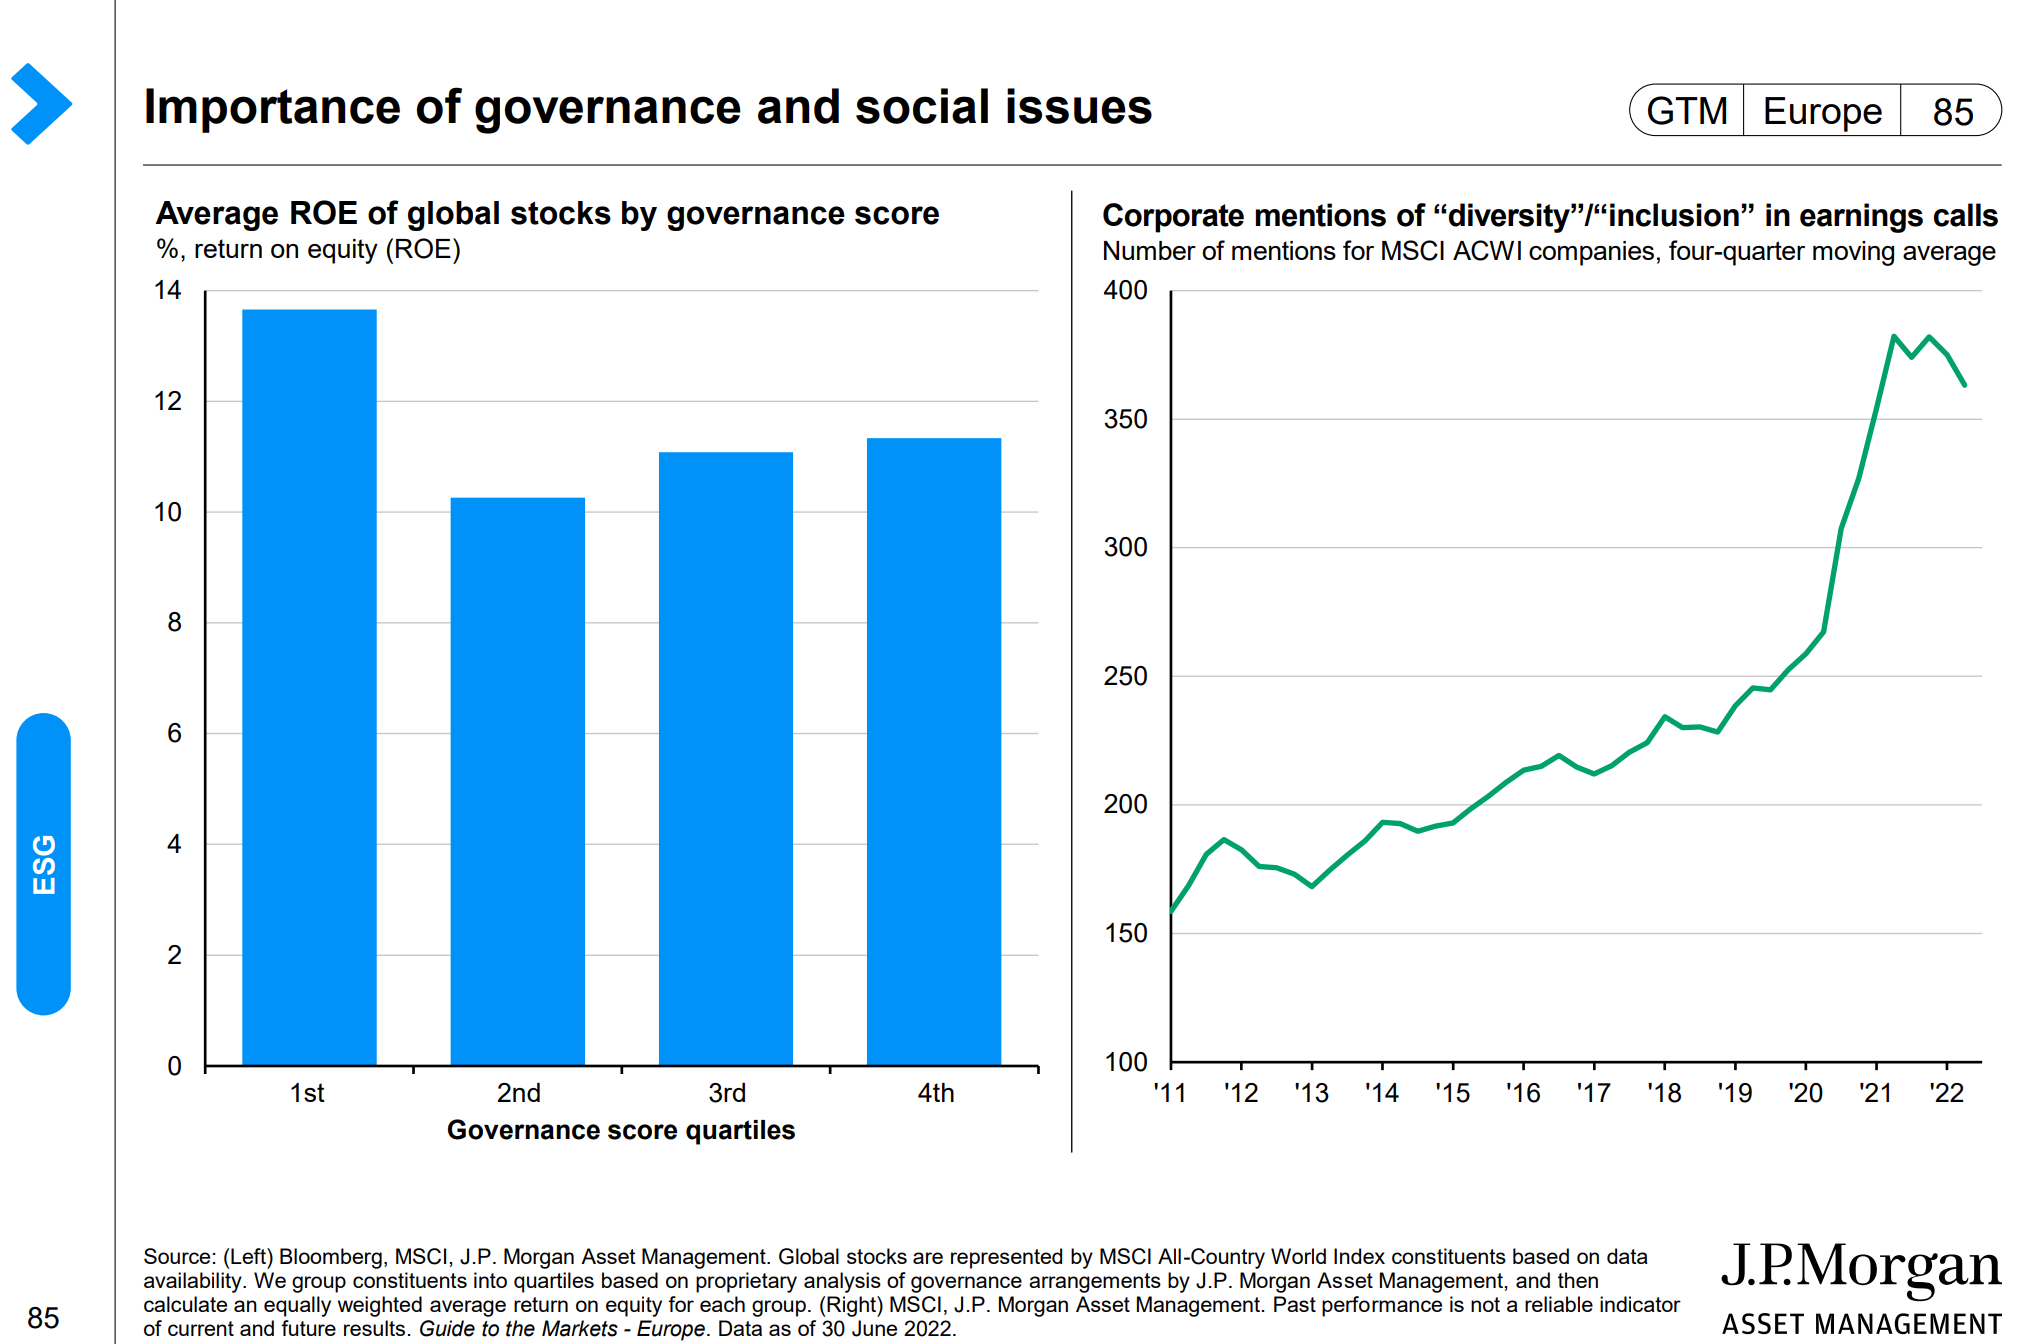
ESG is on the rise. However, the data doesn’t show any clear evidence of outperformance associated with ESG-oriented firms:
Short-sellers are likely to be chasing more clean tech firms. This year HASI and RUN came under the spotlight. Those aren’t obvious short candidates. However, firms like energy vault are more obvious candidates:

The fundamental argument that Muddy Waters is raising is that both RUN and HASI overstated the liquidation book value of the assets.
‘Improving’ or enhancing the FMV of assets by adding additional soft costs isn’t exactly new. When I worked in development, this was pretty standard. So the entire thesis might only play out if the auditors can verify the claims made by MW.
If the auditors don’t bother auditing in the first place, the companies might continue doing what they are doing.
The importance of congestion and additional transmission can’t be overstated. In some cases, especially around Texas, the value of flowing power between regions is as high as 30$/MWh.

Note that this congestion problem is not unique to the US. In hydro-intensive markets like Sweden, this issue is emerging as a concern as well:

The production ramp up of polysilicon manufacturers is remarkable. Furthermore, the second chart shows the stable and declining cost trajectory. After a 6-month increase, costs are down to 7-8$/kg again. While ASP is around 35-40$/kg. Unsurprisingly, DQ solar is a great investment play.
Note: Full disclosure - I’m long DQ.

 in 2022")
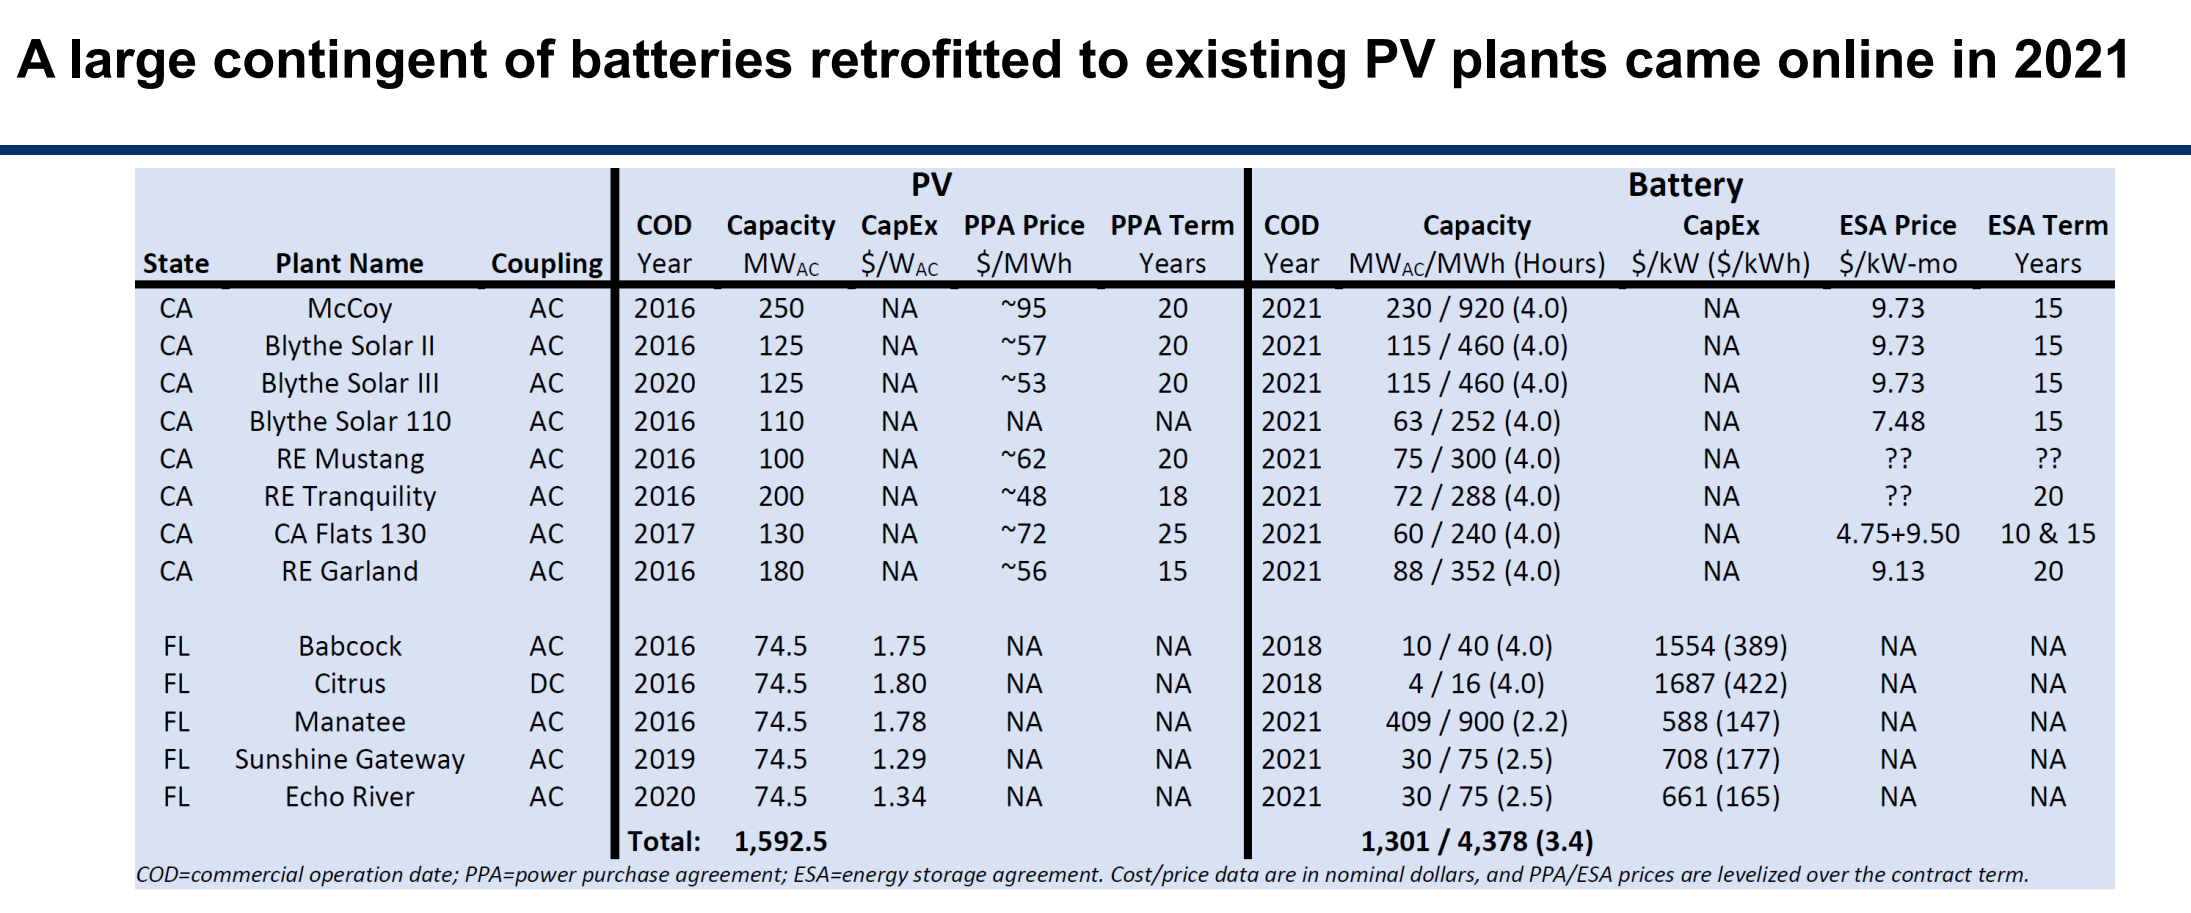
The hybridization of solar power plants has been and continues to be an important theme. The narrative is slightly different now that there’s a standalone ITC for storage assets. But the details might just be associated with the configuration of the SPV underlying the assets.
In the future, asset owners might structure SPVs so that the solar asset is submitted through the PTC and the storage asset is configured with ITC.
This might take creative thinking and legal work, but the overall tailwinds associated with ESS assets remain.

Another interesting thing about the above table is that many natural gas assets are also hybridized. At 27%, the number of ERCOT facilities is not insignificant.
If the above chart proves to be right in terms of PPA pricing, even with modest compression in pricing, and 500GWhs of demand in the US for energy storage services, the total $ TAM for energy storage might be to the tune of 120-140 billion dollars.
That’s not a small #. Globally, we might be a TAM twice the size, i.e. 250-300 billion dollars.
To be continued…